Control Resonant RTX 50 Benchmarks: Path Tracing & DLSS 4.5
Graphics Cards
Key takeaways
- The heaviest settings the game offers. Every run used the Ray Tracing Preset on Ultra — the game's highest path tracing quality — at native resolution with DLAA and no upscaling. That is a heavier load than Remedy's own top system requirement tier, which runs path tracing at High with Performance upscaling.
- Best card for 4K path tracing: RTX 5090 32G, 34.9 FPS native and 179.1 FPS with Multi Frame Generation 6X.
- Best card overall: RTX 5080 16G, 63.3 FPS native at 1080p and 204.7 FPS at 1440p with MFG 6X.
- MFG 6X multiplies frame rates 4.4× to 5.5× (+338% to +447%) on the Ultra preset. The MFG Off column in every table is the true rendered frame rate.
- VRAM: path tracing at 4K allocates 13.7–15.9 GB on cards with 16 GB or more. The RTX 5060 8G has enough memory up to 1440p, but its frame rate makes it a 1080p card for path tracing; at 4K it drops to 1.9 FPS.
- The preset barely matters. With path tracing on, dropping from Ultra to Medium buys only +2.6% to +8.7% at native 4K on cards with enough memory. Path tracing is the load.
Remedy Entertainment's Control Resonant launched on PC on September 24, 2026. You play Dylan Faden in a warped Manhattan on the brink of paranatural annihilation, and the game became Remedy's most successful Steam launch to date (TechSpot, 2026). It is also one of the most demanding PC releases of the year. According to NVIDIA, it launches "with path tracing and NVIDIA RTX Mega Geometry, enhanced by DLSS Ray Reconstruction, and accelerated by DLSS 4.5 Dynamic Multi Frame Generation" (NVIDIA, 2026).
We benchmarked six GeForce RTX 50 graphics cards — the RTX 5090, RTX 5080, RTX 5070 Ti, RTX 5070, RTX 5060 Ti and RTX 5060 — at 1080p, 1440p and 4K, on two presets, with frame generation off and at 6X: 72 configurations in total. All of them ran under the heaviest settings the game offers.
Control Resonant GeForce RTX 50 GPU benchmarks, tested by MSI with the Ray Tracing Preset on Ultra (highest path tracing quality) at native resolution.
How We Tested Control Resonant: Path Tracing On, Native Resolution, No Upscaling
Every number in this article was measured with the Ray Tracing Preset on Ultra and the image rendered at native resolution. Ultra is the top of the game's five ray tracing steps (Off, Low, Medium, High and Ultra). Remedy already labels High as path tracing; Ultra raises direct lighting, indirect lighting and transparency to their highest path-traced quality. Our charts label this configuration RTX Ultra, PT On. We kept it on for all 72 runs, including the Medium preset, so the path tracing load never changes from one result to the next.
What path tracing changes. Conventional ray tracing adds selected effects such as reflections or shadows on top of rasterized lighting. Path tracing simulates how light bounces through the whole scene, so direct light, indirect light and transparency all come from the same physically based calculation. NVIDIA describes the result this way: "Path-traced direct and indirect illumination ensures all of CONTROL Resonant's lighting is physically accurate" (NVIDIA, 2026). It is the most expensive lighting a game can run in real time.
Why This Is a Harder Test Than Most Benchmarks
Our test conditions sit above the highest tier of Remedy's own PC requirements. Remedy's Path Tracing Enthusiast tier targets 4K at 60 FPS with the High preset, Ray Tracing High (path tracing) and Performance upscaling on an RTX 5080, listing 12 GB of VRAM, and its chart lists no frame generation for any tier (Remedy Entertainment via KitGuru, 2026). We moved three settings one step heavier at once:
Our test conditions against the highest tier of Remedy's official PC requirements
Setting
Remedy's top tier (Path Tracing Enthusiast)
MSI test
Resolution
4K, 60 FPS target
Graphics preset
High
Ultra and Medium
Ray tracing
High (path tracing)
Ultra (highest path tracing quality)
Upscaling
Performance
None — native resolution, DLAA
Frame generation
Not listed
Off, and Multi Frame Generation 6X
Graphics cards
RTX 5080 (12 GB VRAM listed)
Six cards, RTX 5090 to RTX 5060
Native resolution is the biggest difference. With DLAA, the game renders at the full display resolution and uses DLSS only for anti-aliasing, so a 4K result means 8.3 million rendered pixels per frame. Performance upscaling at 4K renders a quarter of that and reconstructs the rest. Most published Control Resonant results upscale in some form, NVIDIA's own included.
That is why our numbers look lower. NVIDIA quotes the RTX 5090 at up to 320 FPS at 4K with the Ultra preset, path tracing and 6X frame generation (NVIDIA, 2026). Our native-resolution result on the same card is 179.1 FPS. The arithmetic shows why: 6X frame generation can at most multiply the 34.9 FPS native base by six, which gives 209 FPS. A 320 FPS result therefore has to include upscaling. Neither number is wrong. NVIDIA's shows the best case, and ours shows the floor.
Hardware Setup
All six graphics cards ran on the same MSI platform, so the only thing that changes from result to result is the GPU itself.
- Motherboard: MSI MPG X870E CARBON WIFI
- CPU: AMD Ryzen 7 9800X3D
- CPU Cooler: MSI MEG CORELIQUID S360
- Memory: TOUGHRAM XG RGB D5 DDR5 6600MT/s 32GB (16GB × 2)
- Storage: MSI SPATIUM M570 PRO PCIe 5.0 NVMe M.2 FROZR
- Power Supply: MSI MEG Ai1300P PCIE5
- Graphics cards: MSI GeForce RTX 5090 32G, RTX 5080 16G, RTX 5070 Ti 16G, RTX 5070 12G, RTX 5060 Ti 16G, RTX 5060 8G
- GPU driver: NVIDIA 617.14
In-Game Settings
We ran two settings profiles and measured each one twice at every resolution: once with DLSS Frame Generation off and once at 6X. The upscaler was set to DLSS with the Upscaling Mode on DLAA in both cases, so neither column involves any upscaling.
The two settings profiles used throughout this article
Profile
Graphics Preset
Ray Tracing Preset
Upscaling Mode
DLSS Frame Generation
Quality profile
Ultra
Ultra (path tracing)
DLAA (native)
Off / 6X
Performance profile
Medium
Ultra (path tracing)
DLAA (native)
Off / 6X
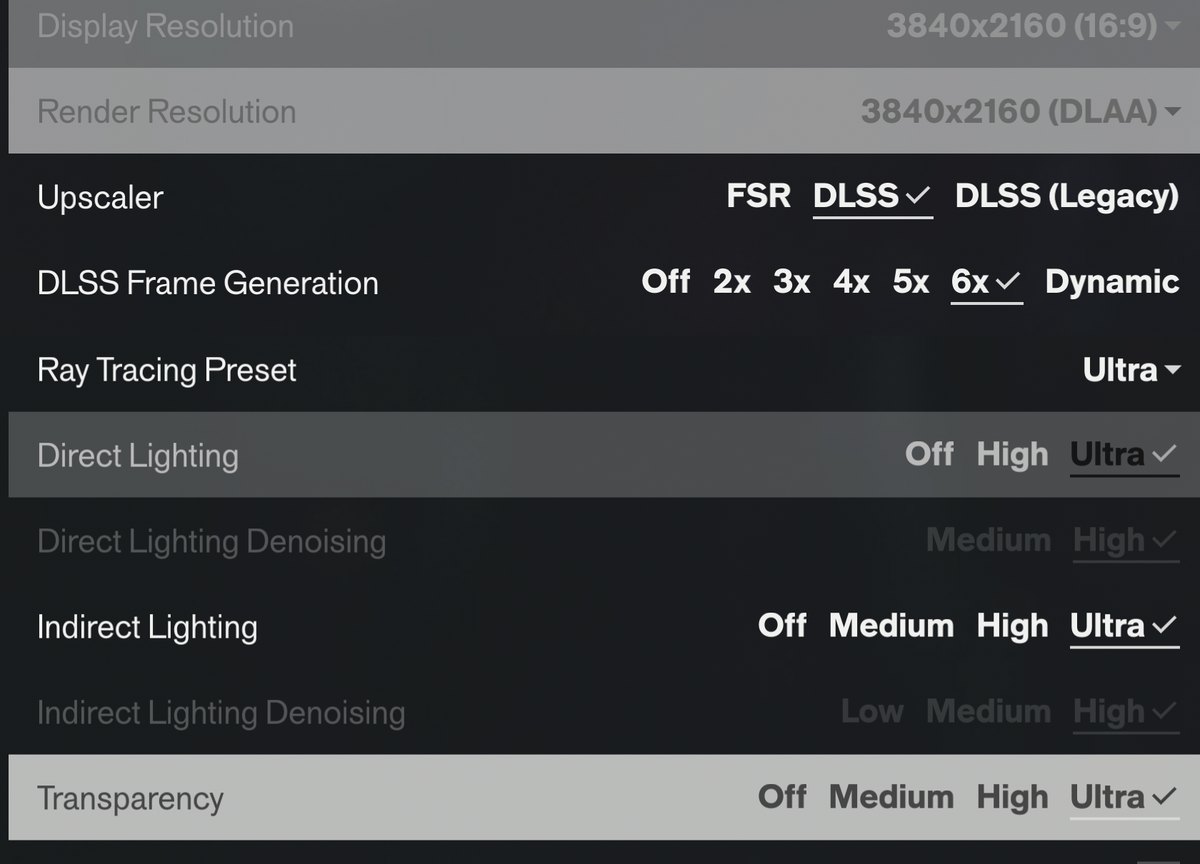
The in-game settings used for the MFG 6X runs, as captured in MSI's lab. Render Resolution matches Display Resolution (DLAA), so no upscaling is applied, and the Ray Tracing Preset is on Ultra.
In our charts the two columns appear as "DLSS Off, Native" and "DLSS 4.5, MFG 6X". At 6X, DLSS 4.5 Multi Frame Generation creates five additional frames for every rendered one, so the theoretical ceiling is six times the native frame rate. The MFG Off column is the frame rate the GPU actually renders. The MFG 6X column is the refresh rate you see, five sixths of which is generated. Generated frames make motion smoother, but the game responds to your input at the rendered rate.
For every run we logged average, minimum and maximum FPS, together with GPU power draw and VRAM allocation. Only the graphics card changed between runs: platform, driver and in-game settings were identical throughout. Every number is reported exactly as measured.
Control Resonant GPU Benchmarks for 1080p: Path Tracing at Full HD
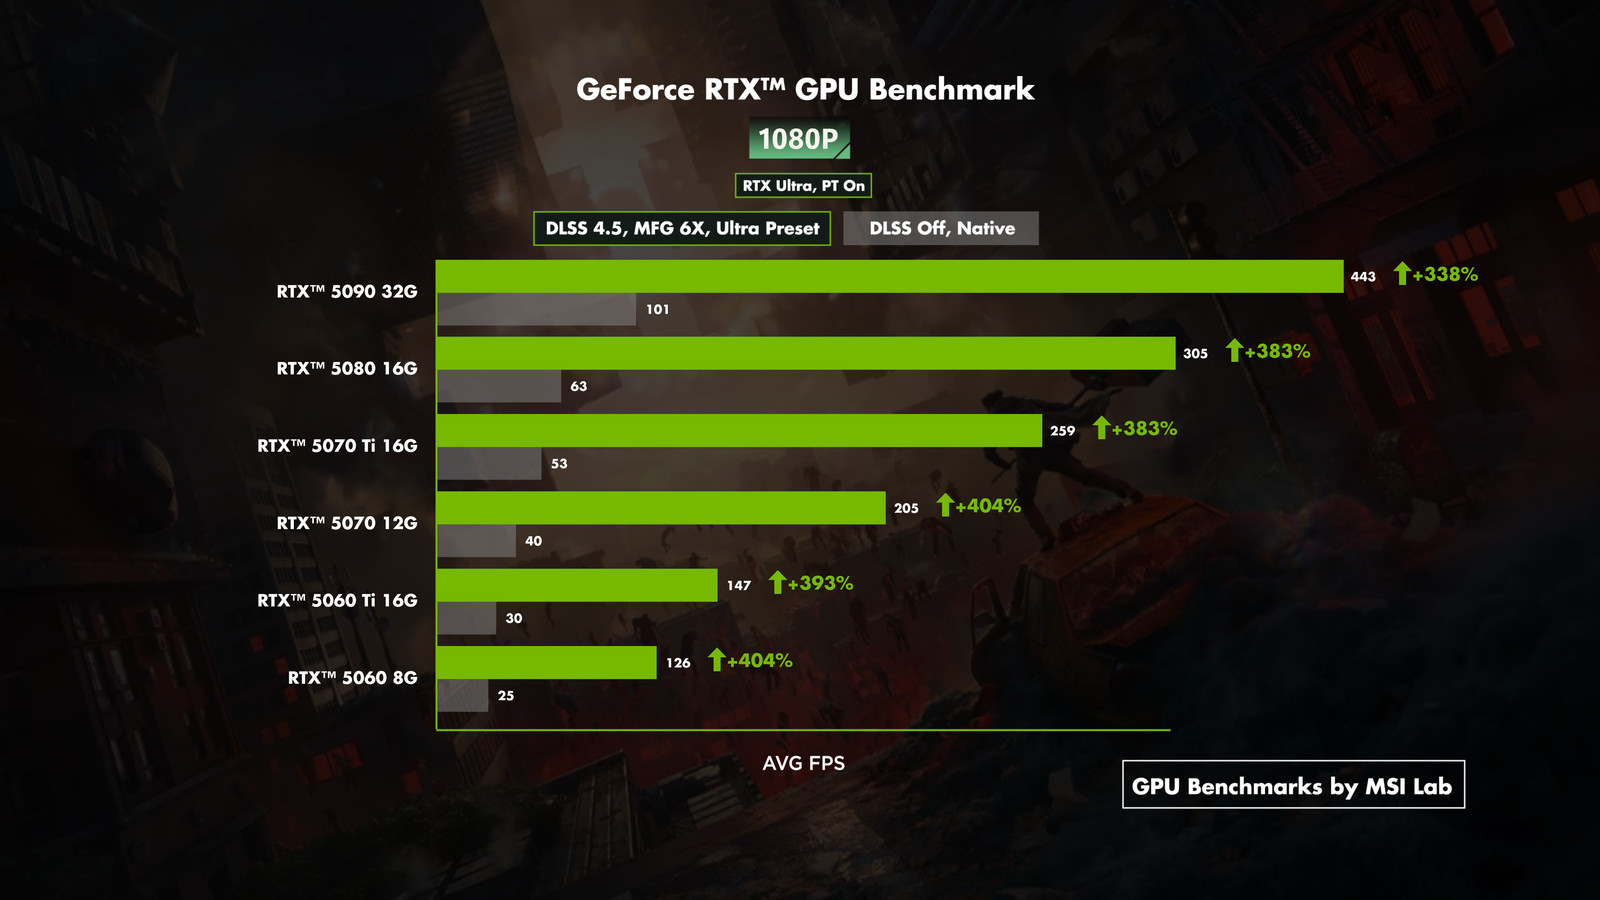
Control Resonant at 1080p Ultra with path tracing on Ultra — Multi Frame Generation 6X takes every card from 25.0–101.1 FPS native to 126.0–443.0 FPS.
1080p on the Ultra Preset
1920×1080, Ultra preset, Ray Tracing Ultra (path tracing), native resolution with DLAA in both columns
Graphics card
MFG Off (Avg. FPS)
MFG 6X (Avg. FPS)
Uplift
MFG Off VRAM (GB)
MFG 6X VRAM (GB)
RTX 5090 32G
101.1
443.0
+338.2%
10.7
11.9
RTX 5080 16G
63.3
305.5
+382.6%
10.8
11.2
RTX 5070 Ti 16G
53.7
259.2
+382.7%
10.6
11.1
RTX 5070 12G
40.7
205.1
+403.9%
10.5
10.6
RTX 5060 Ti 16G
29.9
147.3
+392.6%
10.6
11.1
RTX 5060 8G
25.0
126.0
+404.0%
7.7
7.5
Native path tracing is demanding even at 1080p. Only two cards clear 60 FPS natively: the RTX 5090 at 101.1 FPS and the RTX 5080 at 63.3 FPS. The RTX 5070 Ti follows at 53.7 FPS, then the RTX 5070 at 40.7, the RTX 5060 Ti at 29.9 and the RTX 5060 at 25.0. With Multi Frame Generation 6X, all six land between 126.0 and 443.0 FPS.
Path tracing also raises the memory bar at a resolution where most games are easy on VRAM. Every card with 12 GB or more allocates 10.5–10.8 GB natively at 1080p Ultra, while the RTX 5060 8G holds at 7.7 GB. That shortfall is part of why the 8GB card trails the RTX 5060 Ti 16G by 16.4% here.
1080p on the Medium Preset
1920×1080, Medium preset, Ray Tracing Ultra (path tracing), native resolution with DLAA in both columns
Graphics card
MFG Off (Avg. FPS)
MFG 6X (Avg. FPS)
Uplift
MFG Off VRAM (GB)
MFG 6X VRAM (GB)
RTX 5090 32G
109.0
466.2
+327.7%
10.3
10.5
RTX 5080 16G
69.6
325.6
+367.8%
9.6
9.9
RTX 5070 Ti 16G
59.5
280.8
+371.9%
9.7
9.8
RTX 5070 12G
45.9
225.4
+391.1%
9.4
9.8
RTX 5060 Ti 16G
33.6
163.1
+385.4%
9.6
9.9
RTX 5060 8G
26.7
139.5
+422.5%
7.3
7.2
Medium lifts native frame rates by 6.8% to 12.8%, with path tracing still on. The RTX 5080 reaches 69.6 FPS and the RTX 5070 Ti 59.5 FPS, just short of 60. With MFG 6X the range is 139.5 to 466.2 FPS.
Control Resonant GPU Benchmarks for 1440p: Where Frame Generation Takes Over
1440p on the Ultra Preset
2560×1440, Ultra preset, Ray Tracing Ultra (path tracing), native resolution with DLAA in both columns
Graphics card
MFG Off (Avg. FPS)
MFG 6X (Avg. FPS)
Uplift
MFG Off VRAM (GB)
MFG 6X VRAM (GB)
RTX 5090 32G
68.3
322.9
+372.8%
12.2
12.9
RTX 5080 16G
41.6
204.7
+392.1%
11.8
12.3
RTX 5070 Ti 16G
34.6
170.4
+392.5%
11.6
12.3
RTX 5070 12G
26.2
128.9
+392.0%
11.2
11.1
RTX 5060 Ti 16G
18.9
94.1
+397.9%
11.5
12.2
RTX 5060 8G
16.5
83.2
+404.2%
7.5
7.7
At 1440p with path tracing on Ultra, the RTX 5090 is the only card above 60 FPS natively, at 68.3 FPS. The RTX 5080 renders 41.6 FPS, the RTX 5070 Ti 34.6, the RTX 5070 26.2, the RTX 5060 Ti 18.9 and the RTX 5060 16.5. Multi Frame Generation 6X turns that into 83.2 to 322.9 FPS, with the RTX 5080 at 204.7 FPS and the RTX 5070 Ti at 170.4 FPS — enough to fill a 144 Hz or 165 Hz panel.
Native allocation rises to 11.2–12.2 GB on cards with 12 GB or more. The RTX 5070 sits at 11.2 GB, close to its 12 GB capacity.
1440p on the Medium Preset
2560×1440, Medium preset, Ray Tracing Ultra (path tracing), native resolution with DLAA in both columns
Graphics card
MFG Off (Avg. FPS)
MFG 6X (Avg. FPS)
Uplift
MFG Off VRAM (GB)
MFG 6X VRAM (GB)
RTX 5090 32G
71.6
333.9
+366.3%
11.2
11.4
RTX 5080 16G
44.3
215.1
+385.6%
10.7
11.1
RTX 5070 Ti 16G
37.4
180.9
+383.7%
10.7
10.9
RTX 5070 12G
28.2
137.3
+386.9%
10.5
10.6
RTX 5060 Ti 16G
20.6
100.9
+389.8%
10.3
10.9
RTX 5060 8G
17.2
89.2
+418.6%
7.5
7.6
Medium recovers 4.2% to 9.0% natively at 1440p, which is too little to change any card's position. The RTX 5080 moves from 41.6 to 44.3 FPS. With MFG 6X the range is 89.2 to 333.9 FPS.
Control Resonant GPU Benchmarks for 4K: Native Path Tracing at the Limit
4K on the Ultra Preset
3840×2160, Ultra preset, Ray Tracing Ultra (path tracing), native resolution with DLAA in both columns
Graphics card
MFG Off (Avg. FPS)
MFG 6X (Avg. FPS)
Uplift
MFG Off VRAM (GB)
MFG 6X VRAM (GB)
RTX 5090 32G
34.9
179.1
+413.2%
15.0
15.9
RTX 5080 16G
20.7
107.3
+418.4%
13.7
14.8
RTX 5070 Ti 16G
17.3
91.2
+427.2%
13.8
14.9
RTX 5070 12G
12.9
70.6
+447.3%
11.5
11.3
RTX 5060 Ti 16G
9.2
49.0
+432.6%
14.0
14.7
RTX 5060 8G
1.9
9.3
+389.5%
7.9
7.9
None of the six cards we tested reaches 60 FPS at native 4K with path tracing on Ultra. The RTX 5090 leads at 34.9 FPS, 1.69 times the RTX 5080's 20.7 FPS. The RTX 5070 Ti renders 17.3 FPS, the RTX 5070 12.9 and the RTX 5060 Ti 9.2. The RTX 5060 8G manages 1.9 FPS because it runs out of memory: it allocates 7.9 of its 8 GB.
Multi Frame Generation 6X makes 4K path tracing look smooth on the top four cards: 179.1 FPS on the RTX 5090, 107.3 on the RTX 5080, 91.2 on the RTX 5070 Ti and 70.6 on the RTX 5070. Input still follows the rendered frame rate, though — 34.9 FPS on the RTX 5090 and 12.9 FPS on the RTX 5070 — so the higher the native number, the better 4K feels in the hand. The multipliers are also largest at 4K, between 5.13× and 5.47× on cards with enough memory, against 4.38× to 5.04× at 1080p. That pattern fits frame generation carrying a roughly fixed cost per frame, which matters less when each rendered frame already takes a long time. The RTX 5070's +447.3% is the largest gain in the whole test.
4K on the Medium Preset
3840×2160, Medium preset, Ray Tracing Ultra (path tracing), native resolution with DLAA in both columns
Graphics card
MFG Off (Avg. FPS)
MFG 6X (Avg. FPS)
Uplift
MFG Off VRAM (GB)
MFG 6X VRAM (GB)
RTX 5090 32G
35.8
184.6
+415.6%
13.8
14.8
RTX 5080 16G
21.6
112.8
+422.2%
13.3
14.2
RTX 5070 Ti 16G
18.1
94.1
+419.9%
12.6
13.8
RTX 5070 12G
13.7
72.2
+427.0%
11.3
11.2
RTX 5060 Ti 16G
10.0
52.7
+427.0%
13.3
14.1
RTX 5060 8G
3.3
13.2
+300.0%
7.8
7.8
At 4K, Medium recovers only 2.6% to 8.7% natively on the cards with enough memory. The RTX 5090 goes from 34.9 to 35.8 FPS. The one large jump is the RTX 5060 8G, from 1.9 to 3.3 FPS, because Medium trims enough memory to ease its overflow, though not nearly enough to make it playable.
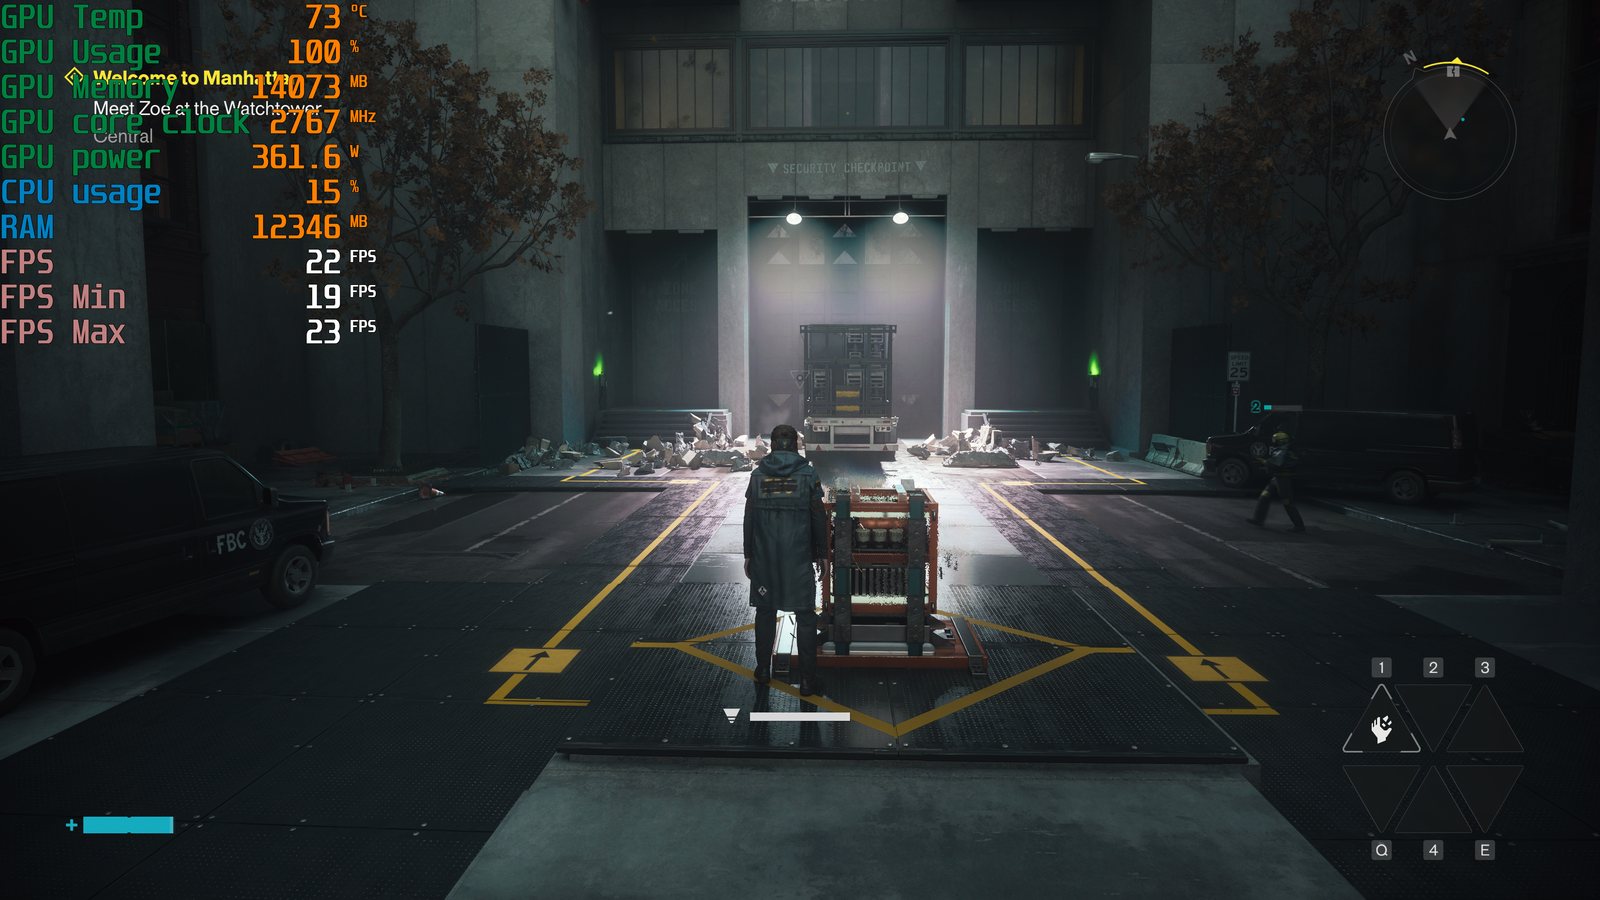
4K, Ultra preset, Ray Tracing Ultra (path tracing), native resolution, frame generation off — MSI GeForce RTX 5080 16G, captured in MSI's lab. The MSI Afterburner overlay reads 22 FPS and 361.6 W at this moment, against a 20.7 FPS run average.
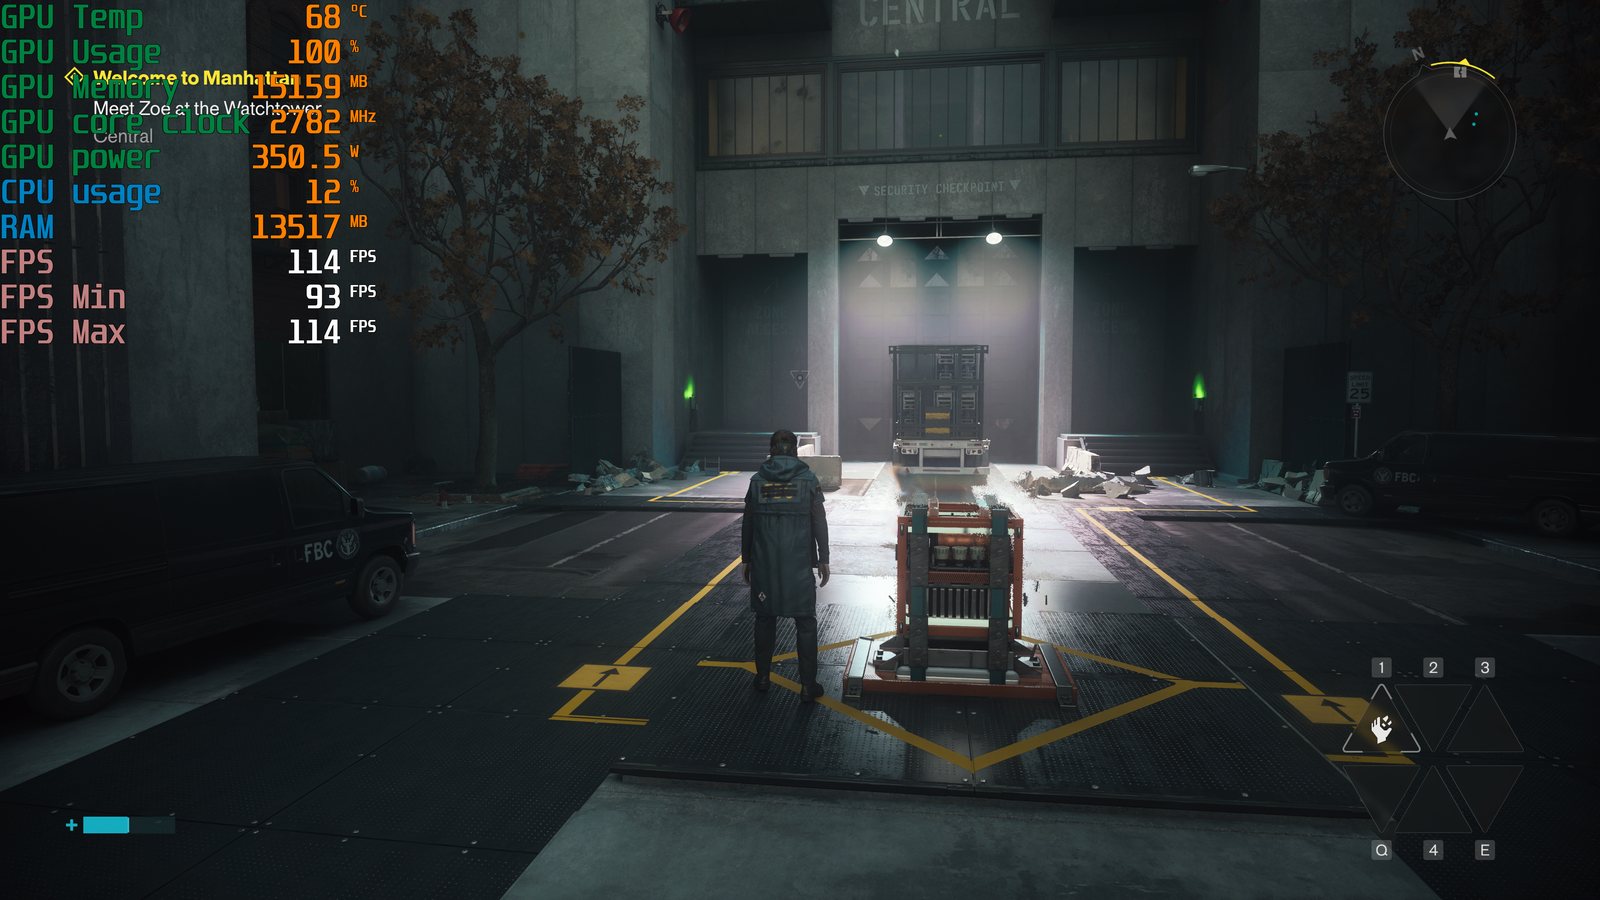
The same scene and settings with DLSS 4.5 Multi Frame Generation 6X — 114 FPS on the overlay against a 107.3 FPS run average, while power draw falls to 350.5 W.
What Graphics Card Do You Need for Control Resonant?
By resolution: native 4K path tracing realistically needs the RTX 5090, the only card above 30 FPS before frame generation. The RTX 5080 16G is the best balance, clearing 60 FPS natively at 1080p and reaching 204.7 FPS at 1440p with MFG 6X. The RTX 5070 Ti 16G is the 1440p choice below it. At 1080p, the RTX 5070 12G and RTX 5060 Ti 16G both deliver over 140 FPS with MFG 6X. The RTX 5060 8G is a 1080p card for path tracing.
The Best GPU for Control Resonant Path Tracing — RTX 5080 16G
All things considered, the MSI GeForce RTX 5080 16G is the card we would pick for Control Resonant with path tracing. It is one of only two cards that clear 60 FPS natively at 1080p with the Ray Tracing Preset on Ultra (63.3 FPS), it reaches 204.7 FPS at 1440p and 107.3 FPS at 4K with Multi Frame Generation 6X, and its 16 GB covers the 14.8 GB the game allocates at 4K.
- 4K — MSI GeForce RTX 5090 32G: 34.9 FPS at native 4K with path tracing on Ultra and 179.1 FPS with MFG 6X. The only card above 30 FPS natively at 4K.
- 1440p and 1080p — MSI GeForce RTX 5080 16G: 63.3 FPS native at 1080p, 204.7 FPS at 1440p with MFG 6X.
- 1440p — MSI GeForce RTX 5070 Ti 16G: 34.6 FPS native and 170.4 FPS with MFG 6X at 1440p, with 16 GB for 4K.
- 1080p — MSI GeForce RTX 5070 12G: 40.7 FPS native and 205.1 FPS with MFG 6X at 1080p.
- 1080p with 16GB — MSI GeForce RTX 5060 Ti 16G: 29.9 FPS native and 147.3 FPS with MFG 6X at 1080p, and the memory to avoid the 4K collapse.
- 1080p entry — MSI GeForce RTX 5060 8G: 25.0 FPS native and 126.0 FPS with MFG 6X at 1080p. Not suited to 4K path tracing.
Treat every number in this article as a floor. We tested the worst case on purpose: path tracing at its highest quality, at native resolution. The game's DLSS upscaling modes will raise the native frame rate on every card, and with it the base that frame generation works from. We did not measure those modes, so we have not estimated them here. If a card handles Control Resonant in our tables, it will handle it at any lighter setting.
Is 8GB of VRAM Enough for Path Tracing in Control Resonant?
Up to 1440p, yes; at 4K, no — and path tracing is the reason. At native 4K Ultra, the cards with 16 GB or more allocate 13.7–15.0 GB with MFG off and 14.7–15.9 GB with MFG 6X. The minimum frame rate shows what happens when a card cannot meet that demand:
4K Ultra with path tracing: VRAM allocation and minimum FPS as a share of the average
Graphics card
VRAM MFG Off
VRAM MFG 6X
Min ÷ Avg MFG Off
Min ÷ Avg MFG 6X
RTX 5090 32G
15.0 GB
15.9 GB
89%
90%
RTX 5080 16G
13.7 GB
14.8 GB
91%
87%
RTX 5070 Ti 16G
13.8 GB
14.9 GB
90%
88%
RTX 5070 12G
11.5 GB
11.3 GB
91%
81%
RTX 5060 Ti 16G
14.0 GB
14.7 GB
88%
81%
RTX 5060 8G
7.9 GB
7.9 GB
58%
16%
Allocation is not the same as need. uch it actively requires. On a card with headroom, allocation usually runs above true demand. On a card already at its limit, the figure runs below what the game wants, because there is no more to give.
Why the RTX 5060 8G Collapses at 4K
At 4K with path tracing, the RTX 5060 8G is out of memory, not out of compute. It allocates 7.9 GB whether frame generation is off or on — effectively all of its 8 GB. Three other measurements point to the same cause.
The first is its same-tier comparison. The RTX 5060 Ti 16G uses the same class of GPU with twice the memory. At 1440p the 8GB card trails it by 12.7%; at 4K the gap becomes 79.3% (1.9 against 9.2 FPS). The second is its minimum frame rate, which falls to 58% of its average with MFG off and 16% with MFG 6X, while every other card stays at 81% or higher. The third is its power draw, which drops from 145.0 W at 1440p to 68.8 W at 4K, the profile of a GPU stalled on memory transfers.
12 GB is the practical minimum for 4K path tracing, and 16 GB is the comfortable amount. The RTX 5070 12G allocates 11.5 GB at 4K, almost all of its capacity, yet keeps its minimum frame rate at 91% of its average natively and posts the largest MFG 6X gain in the test. Remedy lists 12 GB for its 4K path tracing tier. So the answer is: 8 GB of memory is enough up to 1440p, but the RTX 5060 8G's frame rate makes it a 1080p card for path tracing, and at 4K it runs out of memory.
Does Lowering the Preset Help? Not With Path Tracing On
In Control Resonant, the Graphics Preset is not where the performance goes. Path tracing is. We kept the Ray Tracing Preset on Ultra for both presets, and switching everything else from Ultra to Medium recovered very little native performance:
Native frame-rate gain from switching Ultra to Medium, path tracing on in both, MFG off
Graphics card
1080p
1440p
4K
RTX 5090 32G
+7.8%
+4.8%
+2.6%
RTX 5080 16G
+10.0%
+6.5%
+4.3%
RTX 5070 Ti 16G
+10.8%
+8.1%
+4.6%
RTX 5070 12G
+12.8%
+7.6%
+6.2%
RTX 5060 Ti 16G
+12.4%
+9.0%
+8.7%
RTX 5060 8G
+6.8%
+4.2%
+73.7%
The gains shrink as resolution rises, from up to +12.8% at 1080p to as little as +2.6% at 4K, because path tracing scales with the number of pixels while most of what the preset controls does not. If you need more frame rate in this game, change the Ray Tracing Preset, the resolution or the upscaling mode. Changing the Graphics Preset alone recovers little.
Control Resonant GPU Power Draw With Multi Frame Generation 6X
Multi Frame Generation 6X raised frame rates roughly five-fold while GPU power draw never rose more than 2.5% above the MFG Off figure, and fell in 13 of the 18 Ultra results. On the RTX 5080 at 4K Ultra, power fell from 361.6 W to 350.5 W while the average frame rate went from 20.7 to 107.3 FPS. On the RTX 5090 at 1080p Ultra it fell from 553.3 W to 519.4 W.
GPU power draw with MFG off and MFG 6X, Ultra preset, path tracing on
Graphics card
1080p Ultra
Off / 6X
Off / 6X
1440p Ultra
Off / 6X
Off / 6X
4K Ultra
Off / 6X
Off / 6X
RTX 5090 32G
553.3 / 519.4 W
576.0 / 564.8 W
575.3 / 571.3 W
RTX 5080 16G
341.9 / 326.4 W
347.0 / 345.0 W
361.6 / 350.5 W
RTX 5070 Ti 16G
287.5 / 278.0 W
297.0 / 290.6 W
298.0 / 298.7 W
RTX 5070 12G
225.1 / 217.4 W
232.0 / 229.5 W
235.9 / 241.7 W
RTX 5060 Ti 16G
161.9 / 151.6 W
164.0 / 164.4 W
165.0 / 165.3 W
RTX 5060 8G
144.3 / 143.7 W
145.0 / 146.0 W
68.8 / 44.6 W
Measured as frames delivered per watt, MFG 6X lifts the RTX 5080 at 1440p Ultra from 0.12 to 0.59 FPS/W. Most of those extra frames are generated rather than rendered, but they cost almost no additional power. The RTX 5060 8G's 4K figures — 68.8 W and 44.6 W, against 145.0 W at 1440p — show a GPU that spends most of its time waiting on memory rather than working.
Control Resonant Performance FAQ
Which MSI graphics card is best for Control Resonant with path tracing?
The MSI GeForce RTX 5080 16G is the best all-round choice: 63.3 FPS natively at 1080p with the Ray Tracing Preset on Ultra, and 204.7 FPS at 1440p with Multi Frame Generation 6X. For native 4K path tracing, the MSI GeForce RTX 5090 32G is the only card above 30 FPS (34.9 FPS, 179.1 FPS with MFG 6X). The MSI GeForce RTX 5070 Ti 16G covers 1440p at 170.4 FPS with MFG 6X, the MSI GeForce RTX 5070 12G and MSI GeForce RTX 5060 Ti 16G suit 1080p, and the MSI GeForce RTX 5060 8G is a 1080p card for path tracing: its 8 GB holds up to 1440p, but its frame rate does not.
Can the RTX 5060 run Control Resonant with path tracing?
At 1080p, yes, with frame generation. The MSI GeForce RTX 5060 8G renders 25.0 FPS natively at 1080p Ultra with path tracing on Ultra and reaches 126.0 FPS with Multi Frame Generation 6X. At 4K it is not viable: 1.9 FPS natively, because path tracing at 4K needs more than its 8 GB of VRAM. The MSI GeForce RTX 5060 Ti 16G renders 9.2 FPS in the same 4K test.
Is 8GB of VRAM enough for Control Resonant?
For memory, 8 GB holds up to 1440p; for frame rate, the RTX 5060 8G is a 1080p card with path tracing. With path tracing on, every card with 12 GB or more allocates at least 10.5 GB even at 1080p, while the 8GB card stays near 7.5–7.9 GB. At 4K Ultra the cards with 16 GB or more allocate 13.7–15.9 GB and the 8GB card collapses to 1.9 FPS, with its minimum frame rate falling to 16% of its average once MFG 6X is enabled. The MSI GeForce RTX 5070 12G holds at 4K, but at 11.3–11.5 GB it has almost nothing to spare.
What FPS does the RTX 5090 get at 4K with path tracing?
The MSI GeForce RTX 5090 32G averages 34.9 FPS at native 4K on the Ultra preset with the Ray Tracing Preset on Ultra, and 179.1 FPS with DLSS 4.5 Multi Frame Generation 6X. No upscaling was used in either result.
How much does DLSS 4.5 Multi Frame Generation 6X add?
Between +338% and +447% on the Ultra preset across the six MSI GeForce RTX 50 cards we tested, or 4.4× to 5.5× the native frame rate. The theoretical ceiling for 6X is 6×. Gains are largest at 4K, where each rendered frame takes longest. Five of every six frames on screen are generated, so these figures describe motion smoothness rather than rendering performance.
What does the Ray Tracing Ultra setting do in Control Resonant?
Ultra is the highest of the game's five Ray Tracing Preset steps (Off, Low, Medium, High and Ultra). Remedy's requirements chart already labels High as path tracing; Ultra raises direct lighting, indirect lighting and transparency to their highest path-traced quality. It is also the heaviest single setting in the game: at native 4K it holds the MSI GeForce RTX 5090 32G to 34.9 FPS, and dropping the Graphics Preset from Ultra to Medium while keeping it on recovers only 2.6% on that card.
Why are MSI's Control Resonant results lower than other benchmarks?
Because we render every frame at native resolution with DLAA and keep path tracing on Ultra in every run. Remedy's own top requirement tier runs path tracing at High with Performance upscaling, and NVIDIA's published figure of up to 320 FPS for the RTX 5090 at 4K exceeds what 6X frame generation can produce from a 34.9 FPS native base (209 FPS), so it includes upscaling. Our results are the floor for each MSI GeForce RTX 50 card, not the ceiling.
What are the PC system requirements for Control Resonant?
Remedy's minimum tier targets 1080p at 30 FPS on Low with Quality upscaling, a GeForce GTX 1070 and 6 GB of VRAM. Its highest tier, Path Tracing Enthusiast, targets 4K at 60 FPS with the High preset, Ray Tracing High (path tracing) and Performance upscaling on a GeForce RTX 5080, listing 12 GB of VRAM; the chart lists no frame generation for any tier. Every tier needs 16 GB of system RAM and an SSD (Remedy Entertainment via KitGuru, 2026). Our tests ran the Ultra preset with Ray Tracing Ultra at native resolution on MSI GeForce RTX 50 cards, which is above Remedy's highest tier.